Most design teams still make critical decisions based on gut feeling, aesthetic preferences, or incomplete user feedback. This “design by intuition” often leads to wasted resources, disappointed users, and missed business goals. In today’s fast-moving digital landscape, data-driven design offers a proven, evidence-based alternative to guesswork—helping organizations create better products, align stakeholders, and achieve measurable ROI.
This guide delivers a practical, actionable framework for adopting data-driven design, including key steps, tool recommendations, and real-world business impact. Whether you’re new to UX or leading a product team, you’ll learn how to use data-driven design to drive smarter outcomes at every stage.
What Is Data-Driven Design?
Data-driven design is the practice of making design decisions based on both quantitative and qualitative data, rather than relying on opinion or aesthetics.
Unlike “design by gut,” data-driven design grounds every choice in evidence drawn from analytics, user research, and measurable results.
The concept grew out of the need for more predictable success in fields like UX, web, software, and architecture—where guessing can be costly. You may also see related terms like data-informed design (which blends data with expert judgment) and analytics-driven design.
In summary:
- Data-driven design: Bases decisions on actual user data and metrics.
- Opinion-based design: Relies on intuition, trends, or stakeholder preferences.
- Origins: UX, web, and software teams seeking more reliable outcomes.
- Related: Data-informed, analytics-driven, evidence-based design.
Why Does Data Matter in Design?
Leveraging data in the design process consistently leads to better user experiences, higher ROI, and stronger alignment across teams.
Investing in data-driven methods pays off by reducing the risk of design failure, optimizing for actual user needs, and supporting clearer business cases.
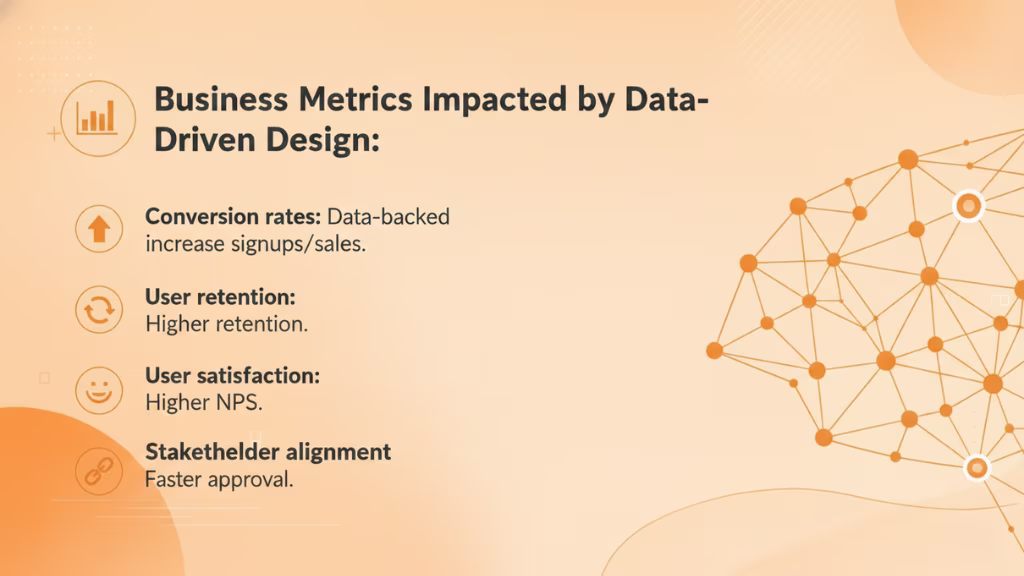
Business Metrics Impacted by Data-Driven Design:
- Conversion rates: Data-backed improvements often increase signups or sales.
- User retention: Products iterated through real user feedback see higher retention.
- User satisfaction: Usability improvements drive higher Net Promoter Scores (NPS).
- Stakeholder alignment: Decisions justified by data reduce debate and speed approval.
According to benchmarks from InVision’s Design Maturity Report, organizations that integrate data into design processes report up to 2x faster time-to-market and significant gains in loyalty and customer satisfaction.
| Business Benefit | Data-Driven Impact Example |
| Increased ROI | Analytics-led UX changes lift conversion by 15% |
| Lower Churn | User feedback loops reduce drop-off by 20% |
| Faster Decisions | Data visualization aligns stakeholders quickly |
| Higher Satisfaction | Data-driven iteration improves NPS by 10+ points |
Design Maturity:
Teams evolve from “intuition-based” to “evidence-driven,” moving through stages from no measurement, to frequent testing, to embedding analytics in every decision (source: Nielsen Norman Group).
What Types of Data Inform Design Decisions?
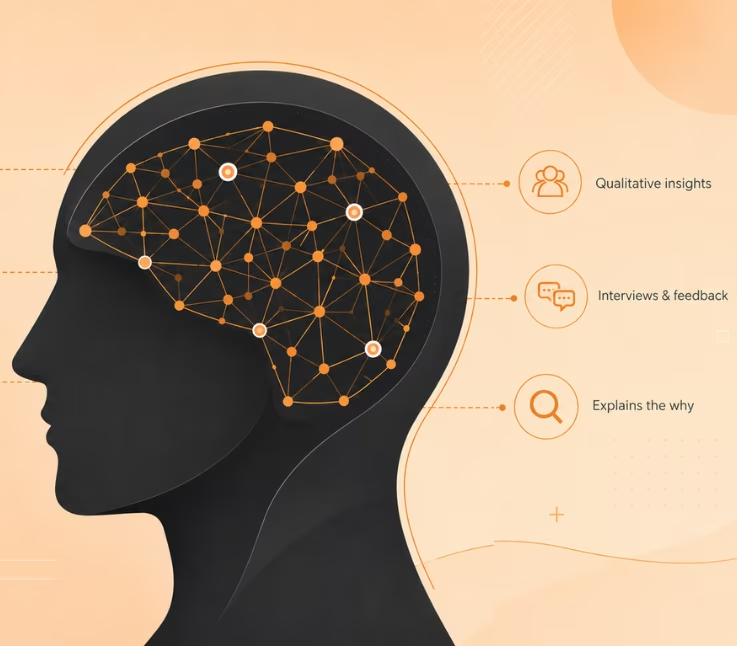
Designers rely on both quantitative and qualitative data.
Quantitative data provides hard numbers and trends, while qualitative data reveals the drivers behind user behaviors and perceptions.
- Quantitative Data: Numeric, measurable, and statistical. Examples: A/B test conversion rates, web analytics, heatmap click counts.
- Qualitative Data: Descriptive, contextual, and open-ended. Examples: User interviews, open survey responses, support call logs.
Both data types are critical—quantitative tells you what is happening, qualitative helps you understand why.
| Data Type | Definition | Examples | Strengths | Limitations |
| Quantitative | Numeric, objective metrics | Analytics, A/B tests, heatmaps | Measurable, scalable | Lacks context/”why” |
| Qualitative | Observational, explanatory insights | Interviews, surveys, feedback | Deep insights, user voice | Harder to scale, may be biased |
Balancing both types ensures decisions are both evidence-driven and user-centered.
How Does the Data-Driven Design Process Work?
Successful data-driven design follows a clear, replicable workflow that integrates measurement, analysis, ideation, testing, and stakeholder communication.
Here is a step-by-step process any team can follow, regardless of experience or resources.
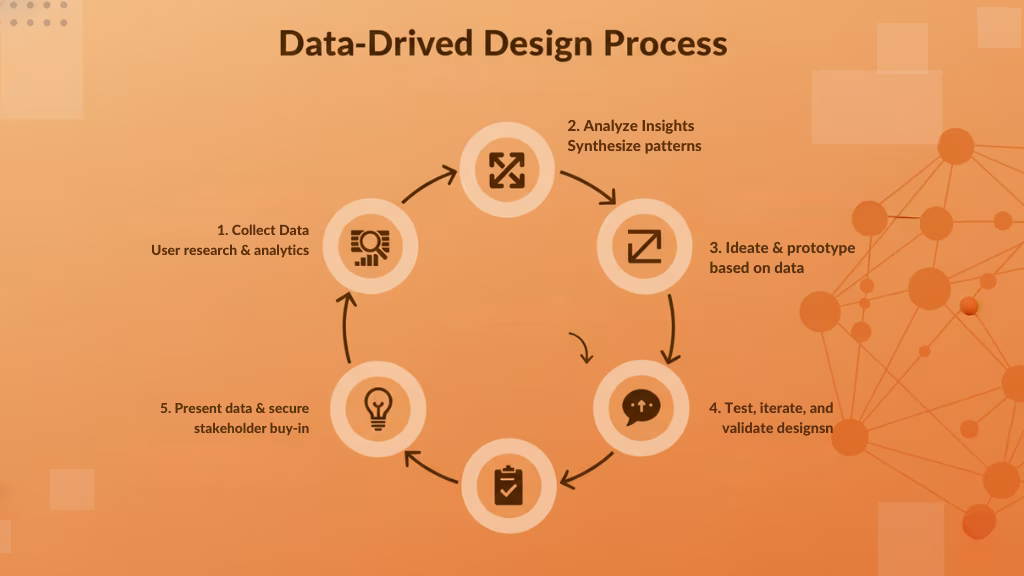
Process Overview:
- Collect meaningful user data
- Analyze & synthesize insights
- Ideate & prototype based on data
- Test, iterate, and validate designs
- Present data & secure stakeholder buy-in
This cyclical process enables continuous improvement, keeping products aligned with real user needs and business outcomes.
Step 1: Collecting Meaningful User Data
Gathering high-quality user data is foundational to data-driven design.
Start by choosing sources and methods that will reveal actual user behaviors and needs.
Common Data Sources:
- Web analytics (e.g., Google Analytics, Mixpanel)
- Heatmaps (e.g., Hotjar, Crazy Egg)
- Surveys (Typeform, Google Forms)
- User interviews and usability tests
- Support tickets and chat logs
Best Practices:
- Ensure data samples are large and diverse enough to represent your user base.
- Avoid leading or biased questions during interviews/surveys.
- Use low-cost, high-impact methods if resources are limited (short polls, remote testing).
For example, even startups can begin with simple feedback widgets and basic analytics to gather actionable insights.
Step 2: Analyzing & Synthesizing Insights
Once you’ve gathered data, turn raw numbers and comments into actionable findings.
Effective analysis distinguishes patterns from noise and connects metrics to user outcomes.
Common Techniques:
- Empathy mapping: Visualize what users think, feel, say, and do (tool: Miro).
- Affinity diagramming: Cluster insights and pain points to spot trends.
- KPI identification: Track metrics like task completion, NPS, retention.
Mindset:
Practice “sensemaking”—seek context, not just numbers. Use data visualization tools to highlight trends and share findings across teams.
Example: Use a combination of Google Analytics session data and interview notes, mapping both onto an empathy map to reveal user frustrations leading to abandonment.
Step 3: Ideation & Prototyping Based on Data
With clear insights, brainstorm targeted solutions and bring them to life through prototyping.
Data-driven ideation aligns your design concepts with proven user needs and opportunities.
Best Practices:
- Formulate hypotheses (e.g., “If we simplify onboarding, completion rates will rise.”)
- Prioritize solutions addressing high-impact issues
- Use wireframing and prototyping tools (Figma, InVision) for rapid iteration
Hypothesis-driven design ensures each prototype is rooted in a user problem supported by evidence.
Step 4: Testing, Iterating, and Validating Designs
Testing closes the loop, measuring how well new designs solve actual pain points.
Iterative cycles help teams validate ideas and refine based on real feedback.
Testing Methods:
- A/B testing: Compare multiple design versions for conversion or satisfaction.
- Usability testing: Observe users performing tasks; record errors and time-on-task.
- Remote analytics: Use event tracking or heatmaps to monitor real-world performance.
Run “minimum viable tests”—small, low-cost experiments to gather feedback fast, then iterate designs based on what the data says.
Example: An ecommerce team might A/B test two checkout flows, picking the version that reduces abandonment.
Step 5: Presenting Data & Securing Stakeholder Buy-In
Articulating your findings with clear, visual data is key to winning stakeholder support.
The best presentations communicate insights through compelling stories, dashboards, and data visualizations.
Techniques:
- Build narratives that link data to business goals (e.g., “This change can boost retention by…”).
- Use graphs, dashboards, and annotated screenshots.
- Prepare for objections by explaining methodologies and addressing limitations.
By anchoring design proposals in clear evidence, teams can overcome resistance and align cross-functional decision-makers.
What Tools Power Data-Driven Design?
A strong data-driven design process relies on an array of analytics, research, prototyping, and visualization tools.
Below is a categorized, up-to-date matrix of top software solutions commonly used in B2B and product teams.
| Category | Tool Name | Core Features | Ideal Use Case |
| Analytics | Google Analytics | Traffic, behavior, conversion metrics | Web/app usage analytics |
| Mixpanel | Event tracking, cohort analysis | Product feature usage | |
| Heatmapping | Hotjar | Heatmaps, session recording, polls | Visualizing user clicks |
| Crazy Egg | Scroll/click maps, simple A/B testing | Conversion optimization | |
| User Feedback | Typeform | Custom surveys, integrations | Collecting qualitative data |
| UsabilityHub | Rapid user testing, feedback | Quick design feedback | |
| Prototyping | Figma | Collaborative design/prototyping | UI/UX mockups |
| InVision | Interactive prototyping, handoff | User flow validation | |
| Journey Mapping | Miro | Affinity/empathy mapping, collaboration | Visualizing experience |
| Data Viz | Tableau | Advanced analytics visualization | Presenting complex data |
How Data-Driven Design Differs Across Fields
Data-driven design adapts to various disciplines, with each field emphasizing unique data types and methodologies.
| Field | Core Approach/Technique | Examples |
| UX/Web | Usability testing, journey maps | Redesigning web flows based on user clicks |
| Architecture | Digital twins, modeling | Energy analysis, virtual building simulations |
| Software | Data-driven programming | Event-driven architecture, telemetry-led design |
| Service Design | Touchpoint mapping, feedback | Optimizing customer support with data |
- UX/UI: Data guides everything from wireframes to flows using analytics, heatmaps, and interviews.
- Architecture: Tools like digital twins mirror buildings for simulating changes before construction.
- Software: Metrics and logs inform APIs, UIs, and infrastructure design.
- Service/Product Management: Surveys and operational metrics refine touchpoints and processes.
While the core principle—using evidence for better decisions—remains the same, execution varies by target, tool, and data granularity.
Common Pitfalls, Myths, and Challenges in Data-Driven Design
Despite its promise, adopting data-driven design can be challenging without the right mindset and infrastructure.
Common Myths vs. Facts
| Myth | Fact |
| “All you need is analytics.” | Expert judgment augments, not replaces, data |
| “More data means better decisions.” | Qualitative input is essential for context |
| “It’s only for big teams/companies.” | Quality beats quantity; focus on actionable insight |
| “It’s only for big teams/companies” | Startups can apply data-driven methods with lightweight tools |
Key Challenges:
- Data quality issues (incomplete, biased, unstructured)
- Analysis paralysis (too much data, unclear next steps)
- Stakeholder resistance (change management, skepticism)
- Organizational maturity (skills, tools, processes)
Solutions: Begin with pilot projects, provide cross-training on tools and methods, and focus on early incremental wins to build confidence.
Data-Driven Design FAQs
What is data-driven design?
Data-driven design is an approach that bases design decisions on a combination of quantitative and qualitative evidence, rather than relying on intuition, aesthetics, or opinion alone. It emphasizes measurable outcomes and continuous improvement.
What are the steps in a data-driven design process?
The main steps are: collecting user data, analyzing and synthesizing insights, ideating and prototyping solutions, testing and iterating designs, and presenting findings to secure stakeholder buy-in.
What types of data inform design decisions?
Both quantitative data (such as analytics, A/B tests, and heatmaps) and qualitative data (like interviews, surveys, and user feedback) are used. Combining both types leads to more robust decisions.
How does data-driven design differ from data-informed design?
Data-driven design bases most decisions directly on measured evidence, while data-informed design blends data with expert judgment, allowing for context and creativity alongside analytics.
Conclusion
Data-driven design transforms how products are conceived, built, and evolved—bringing together analytics, user insight, and agile experimentation. As AI and automation deepen their role in UX and product development, teams that invest now in strong data practices will outpace competitors on usability, ROI, and user loyalty.
Key Takeaways
- Data-driven design replaces guesswork with real evidence for better UX and business results.
- Both quantitative and qualitative data matter—balance numbers with context.
- Use a clear process: collect data, analyze, ideate, test, and communicate findings.
- The right tools and templates speed up adoption; download our resource kit to get started.
- Overcoming myths, resistance, and skill gaps is part of the journey—focus on pilot wins and continuous learning.
This page was last edited on 2 June 2026, at 10:49 am

Start a conversation with our team to solve complex challenges and move forward with confidence.