
Software development KPIs are essential metrics that measure productivity, quality, and impact for engineering teams. In 2026, leading frameworks include DORA, SPACE, and DX Core 4. Top KPIs are deployment frequency, lead time for changes, MTTR, change failure rate, developer satisfaction, and AI tool usage.
Leaders in software development today face intense pressure to deliver fast, high-quality products while keeping teams engaged and business goals in focus. The stakes are even higher with rapid advances in AI and evolving teamwork models.
In my experience, what organizations choose to measure—and how they measure it—sets the tone for team success. Relying on old metrics won’t cut it for 2026’s expectations around speed, quality, and innovation.
This guide will help you cut through confusion around KPIs, grasp new industry benchmarks, and get practical advice to track, improve, and communicate what matters in software engineering.
Why Do Software Development KPIs Matter in 2026?
Software development KPIs drive real improvement by making productivity, quality, and team health visible and actionable for engineering leaders.
When chosen well, KPIs connect engineering work to broader business outcomes. In 2026, changes like remote work, DevOps acceleration, and AI adoption have made precise measurement even more essential. I have seen teams waste effort chasing vanity metrics or demotivate developers through poor measurement. Good KPIs give everyone a clear sense of progress and focus.
Key benefits of software development KPIs in 2026:
- Align engineering goals with business outcomes
- Improve productivity and deployment speed
- Support team well-being and satisfaction
- Identify and reduce technical debt
- Track AI’s real contribution to output
Using KPIs helps teams measure progress clearly. Google’s DORA metrics track delivery speed, reliability, recovery time, and quality, helping engineering leaders improve performance without sacrificing stability.
What Are the Main Software Development KPI Frameworks?
In early software measurement, teams picked metrics at random. By 2026, most high-performing organizations use structured frameworks like DORA, SPACE, and DX Core 4 to guide measurement and help make meaningful improvements. In my POV, frameworks make it possible to compare progress, win buy-in, and avoid common blind spots.
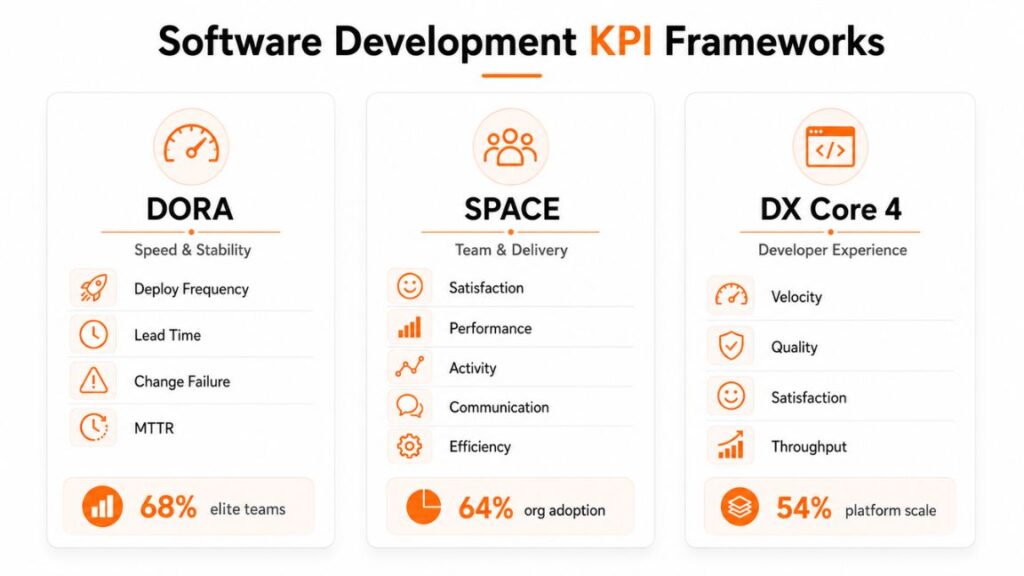
Each framework adds value. Let’s break down what they mean for teams and how they are applied.
DORA Metrics Explained
DORA (DevOps Research and Assessment) metrics capture the pulse of software delivery. In my experience, they are the industry standard for quantifying engineering throughput and stability.
The 4 DORA metrics:
- Deployment Frequency – how often code is released to production
- Lead Time for Changes – time from code commit to production release
- Change Failure Rate – % of deployments causing incidents
- Mean Time to Recovery (MTTR) – how quickly teams restore service
According to the 2026 DORA report, elite teams:
- Deploy multiple times per day
- Keep MTTR under 60 minutes
- Maintain a change failure rate below 7%
Teams achieve these numbers using automation, a strong incident process, and regular metric review.
SPACE & Human-Centric KPIs
The SPACE framework widens focus to include not just delivery speed but also team health and collaboration. I have seen this approach help teams spot issues missed by flow metrics alone.
SPACE covers:
- Satisfaction & well-being
- Performance (outcomes)
- Activity (contributions)
- Communication & collaboration
- Efficiency & flow
Human-centric measurement is essential for tracking developer happiness, reducing burnout, and building a sustainable engineering culture. Many teams combine SPACE with DORA to get a full picture.
DX Core 4 and DevEx
DX Core 4 emerged as teams needed a way to measure developer experience (DevEx) and platform effectiveness at scale. It offers four core KPIs:
- Velocity (speed)
- Quality (defect levels, code health)
- Satisfaction (developer surveys)
- Throughput (completed work)
In practice, I’ve seen this framework fit well for engineering organizations managing internal platforms or multiple teams. It balances technical and human factors in performance reviews.
AI-Driven KPIs: The Next Frontier
AI-assisted development has become mainstream. According to TrueUp, 37% more teams tracked at least one AI-related KPI this year.
Emerging AI-driven KPIs:
- AI Tool Utilization Rate: % of developers using AI pair-programming tools
- AI Code Confidence: developer trust in AI-suggested code
- AI ROI: time or cost saved attributed to AI tooling
Teams track these metrics to understand the direct impact of tools like GitHub Copilot, Cursor, or custom LLM agents.
What Are the Top 15 Software Development KPIs for 2026?
Choosing the right KPIs helps teams focus, improve, and benchmark. Based on recent research and what I have seen work best, here are the 15 most impactful software development KPIs for 2026:
| KPI | Definition | Why It Matters | 2026 Benchmark | When to Use / Caveats |
|---|---|---|---|---|
| Deployment Frequency | Releases to production per week | Measures delivery speed | Elite: > daily | Works best with automation |
| Lead Time for Changes | Time from commit to production | Faster cycle = higher agility | Elite: <24 hours | Can’t shortcut thorough testing |
| Mean Time to Recovery (MTTR) | Time to restore service after failure | Shows resilience and incident response | Elite: <60 minutes | Needs strong incident process |
| Change Failure Rate | % changes causing failures | Monitors risk and reliability | Elite: <7% | Context needed for greenfield/legacy blend |
| Cycle Time | Time for a feature to progress through workflow | End-to-end speed | Elite: <2 days | Requires agreement on start/end points |
| Bug Rate | New bugs per release | Tracks code quality | <1 per 1000 lines | Unit varies by product size |
| Code Coverage | % code covered by automated tests | Guardrails for reliability | >85% (for critical systems) | High % not always equals high quality |
| Technical Debt Ratio | Effort to fix code debt vs. new work | Flags future obstacles and cost | <20% of total effort | Needs realistic scoping |
| Flow Efficiency | % of productive time vs. waiting in process | Identifies bottlenecks | >60% | Accurate with clear workflow mapping |
| Engineering Allocation | % time spent on new features vs. maintenance | Balances innovation and stability | 65% features, 35% maintenance | Different by company maturity |
| Developer Satisfaction | Surveyed developer happiness | Linked to retention and productivity | >4/5 average | Needs honest, safe feedback |
| Developer eNPS | Net promoter score (“would you recommend working here?”) | Culture and loyalty signal | >50 | Useful for periodic check-ins |
| Engagement Metrics | Participation in reviews, standups, commits | Shows involvement | 80%+ engagement | Beware surface activity as proxy for impact |
| AI Tool Utilization Rate | % using AI coding tools | Tracks AI adoption | >70% in AI-enabled orgs | Overuse can mask learning gaps |
| AI Code Confidence | Confidence in AI-produced code (surveyed) | Assesses trust and risks with AI code | 4.2/5 avg. reported by teams | Early, not yet standardized |
Each metric fits a different context. For example, DORA KPIs work well in delivery and ops-focused teams, while DevEx KPIs help platforms or complex product orgs. Use metrics together for coverage, avoid only tracking activity.
Quick note: Watch for metric misuse. The mistake I see often is tracking metrics (like code churn) with no tie to outcomes. Use these KPIs to guide decisions, not as blunt scoring.
How Do You Implement and Track Software Development KPIs Effectively?
Tracking software development KPIs is more than dashboards. The real issue is building a practice that connects metrics to action. Here’s how most effective teams set up, review, and improve their KPI process.
Successful implementation follows four basic steps:
- Select KPIs Aligned with Goals: Review business and engineering objectives first. Pick metrics from frameworks like DORA, SPACE, or DX Core 4 that map to those outcomes.
- Set Up Dashboards and Tools: Use purpose-built dashboards to collect and share data. Top tools in 2026 include Jellyfish, Cortex, and built-in platform solutions. These tools help teams visualize trends and spot bottlenecks.
- Review and Act Cyclically: Schedule regular reviews. Discuss patterns as a team, identify weak spots, and agree on improvement actions. The best teams update metrics and adjust or drop KPIs that lose relevance.
- Avoid Pitfalls and Foster Buy-In: Explain the ‘why’ behind each metric. Foster a culture where metrics are for growth, not policing.
KPI Dashboards & Tracking Tools
Easy-to-use dashboards improve transparency and engagement. In my experience, a good dashboard:
- Updates in real time
- Visualizes key KPIs in one view
- Enables drill-down for root cause analysis
- Offers team-level, not just individual, insights
A sample dashboard template should include sections for DORA metrics, flow efficiency, and developer satisfaction. Request a free copy by contacting Riseup Labs.
Avoiding the KPI Trap: Goodhart’s Law & Metric Gaming
Goodhart’s Law states: “When a measure becomes a target, it ceases to be a good measure.” I have seen teams chase story points or PR counts, creating gaming and false improvement.
Watch for these issues:
- Too much focus on single metrics (e.g., PR count spikes, low-value deployments)
- Using KPIs as punitive tools, not improvement guides
- Ignoring context when teams have different roles or tech stacks
A better approach is to review metrics as a starting point for discussion, not grading. Survey feedback often catches early signals of gaming before numbers alone do.
Step-by-Step Guide: Rolling Out KPIs in Your Team
- Explain the Rationale: Share why you’re measuring and which KPIs will be tracked.
- Involve the Team: Let developers review, suggest, or veto KPIs.
- Start Small: Roll out metrics with a pilot group first.
- Iterate Based on Feedback: Schedule a review after one sprint.
- Celebrate Small Wins: Highlight even modest improvements.
- Refine or Expand KPIs: Add or adjust metrics as maturity grows.
Quick Verdict: Implementation is a journey. Teams that start with shared goals and steady review get the most value from software development KPIs.
How Does AI Change Software Development KPI Measurement?
AI has started to reshape what and how we measure in software development. In my experience, AI alters both the process and the impact of many KPIs.
AI coding tools automate repetitive tasks, suggest code, and reduce time spent on routine bugs. But they also require new metrics to gauge their effect. For example, looking only at output misses if AI tools are producing unreviewed or untested code.
Key AI-specific KPIs in 2026:
- Time saved per engineer through AI features
- AI adoption/utilization rate in feature branches
- AI code confidence (developer-rated reliability)
- Percentage of code reviewed by humans after AI assist
I have seen teams misinterpret AI metrics, assuming higher usage always equals higher productivity. It’s important to balance AI-driven KPIs against quality controls and human feedback.
AI tools bring big efficiency gains but can introduce silent risks. Google DORA’s AI research highlights the importance of measuring AI’s impact across delivery, quality, security, and developer well-being. Data shows 37% YoY growth in teams tracking AI KPIs—measure outcomes, not just activity.
What Are the Most Common Pitfalls When Using Software Development KPIs?
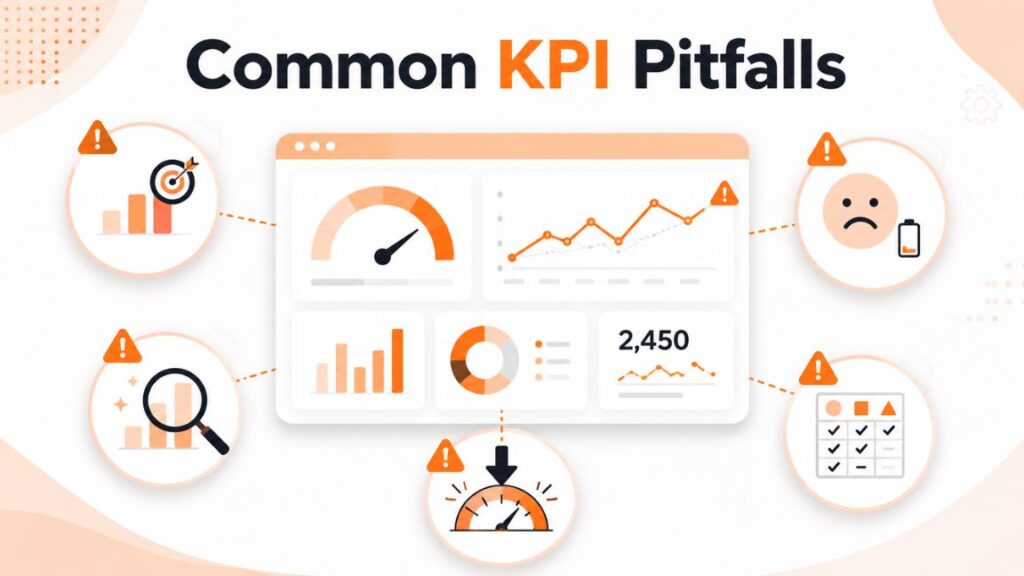
In my experience, software teams suffer when they choose KPIs poorly or use them the wrong way. The real issue is failing to link metrics to outcomes or misaligning them with what truly matters.
Common mistakes include:
- Measuring outputs (lines of code, story points) instead of value delivered
- Ignoring team morale and satisfaction metrics
- Tracking vanity metrics like code churn without context
- Using metrics as a stick, not for feedback or learning
- Failing to adjust KPIs for unique team roles or project needs
To avoid these, focus on holistic, outcome-driven KPIs and use metrics as a conversation starter, not an end in themselves.
Why Choose Riseup Labs For KPI And Engineering Analytics Support?
Many teams struggle to connect software development KPIs with real business goals or build dashboards that lead to better decisions. Riseup Labs offers data analytics, reporting, and dashboard services that help businesses turn performance data into clear, actionable insights.
We offer:
- KPI dashboard and reporting support
- Custom analytics solutions tailored to your business needs
- Data-driven insights to connect team performance, operations, and business outcomes
- Hands-on support for building reports that help leaders track progress and act faster
Book a KPI consultation to discuss your goals, review reporting needs, and explore how better analytics can support your engineering and business performance.
Conclusion
Software development KPIs help engineering teams understand what is working, what needs improvement, and how technical work supports business goals. The best metrics go beyond speed alone. They also measure quality, reliability, team health, developer experience, and the real impact of AI tools.
To get better results, review KPIs regularly, focus on outcomes instead of vanity metrics, and make insights easy for leaders, product teams, and developers to understand. Teams that combine clear measurement with honest feedback are more likely to improve performance without hurting morale.
If your team wants to turn engineering data into clearer decisions, Riseup Labs can help with KPI dashboards, analytics support, and reporting solutions built around your goals.
FAQs
What are software development KPIs?
Software development KPIs are metrics that measure how engineering teams deliver, their code quality, team health, and business impact.
Which KPI frameworks are best for engineering teams in 2026?
DORA, SPACE, and DX Core 4 are the top frameworks. Each addresses speed, collaboration, quality, and team satisfaction.
How do DORA, SPACE, and DX Core 4 frameworks differ?
DORA focuses on delivery speed and reliability. SPACE adds team satisfaction and human factors. DX Core 4 integrates all these for developer experience.
What are the top 5 KPIs for developer productivity?
Deployment frequency, lead time for changes, MTTR, change failure rate, and developer satisfaction are most used to measure productivity.
How do AI tools impact software KPI measurement?
AI tools add new KPIs like AI utilization rate, code confidence, and time saved, giving a fuller view of productivity and AI’s contribution.
What are common mistakes in setting software development KPIs?
Common mistakes include tracking vanity metrics, ignoring team morale, and failing to connect metrics to business outcomes.
How can I implement a KPI dashboard for my engineering team?
Choose meaningful KPIs, use platforms like Jellyfish or Cortex, set up shared dashboards, and review metrics as a team regularly.
Should KPIs be set at a team or individual level?
KPIs work best at the team level to encourage collaboration and shared improvement, not individual competition.
How can developer satisfaction be measured as a KPI?
Use regular anonymous surveys, developer eNPS, and open-ended feedback to track satisfaction as a metric.
What benchmarks should I use for MTTR and deployment frequency?
Leading teams aim for MTTR under 60 minutes and deploy multiple times per day, according to the latest DORA benchmarks.
This page was last edited on 9 July 2026, at 11:07 am

Start a conversation with our team to solve complex challenges and move forward with confidence.