The Challenge
Users in the maritime domain often face significant friction when navigating large datasets to find precise nautical charts. On the client’s website, the traditional discovery process presented several critical pain points:
- Discovering Relevant Charts: Navigating through large datasets to locate specific nautical charts was overly complex.
- Difficult Filtering: Users lacked an intuitive way to filter charts based on specific criteria such as region, type, and hydrographic office.
- Unclear Chart Coverage: It was difficult for buyers to understand the exact geospatial coverage of a chart before committing to a purchase.
- Complex Customization: Requesting customized or digital chart solutions was a disjointed process.
This friction resulted in:
- Low conversion rates
- Increased manual support requests and inquiries
- Poor overall user experience in chart discovery
The Solution
To address these pain points, the core initiative was to bridge geospatial interaction directly with Shopify’s eCommerce system. A comprehensive, GIS-powered interactive chart navigator was implemented to allow users to visually explore charts and make informed purchasing decisions.
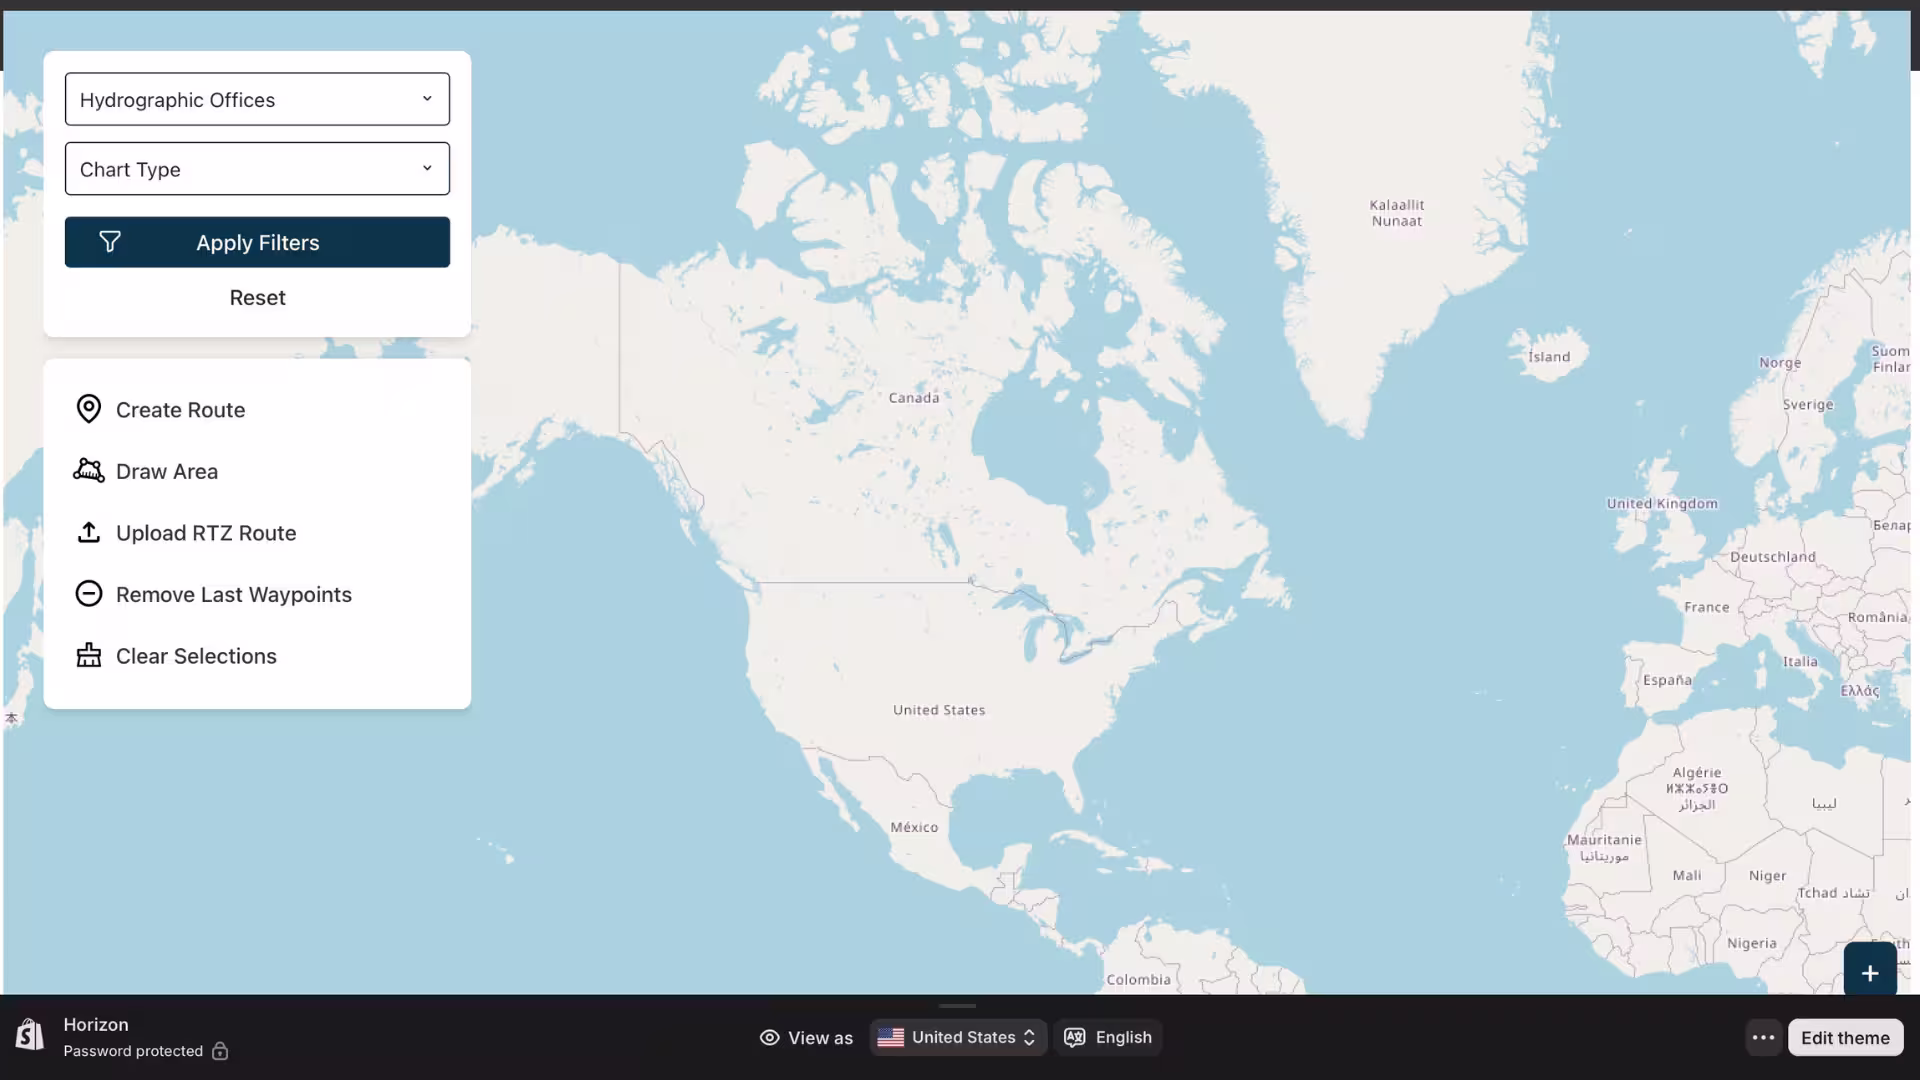
1. Chart Selector (Core Feature)
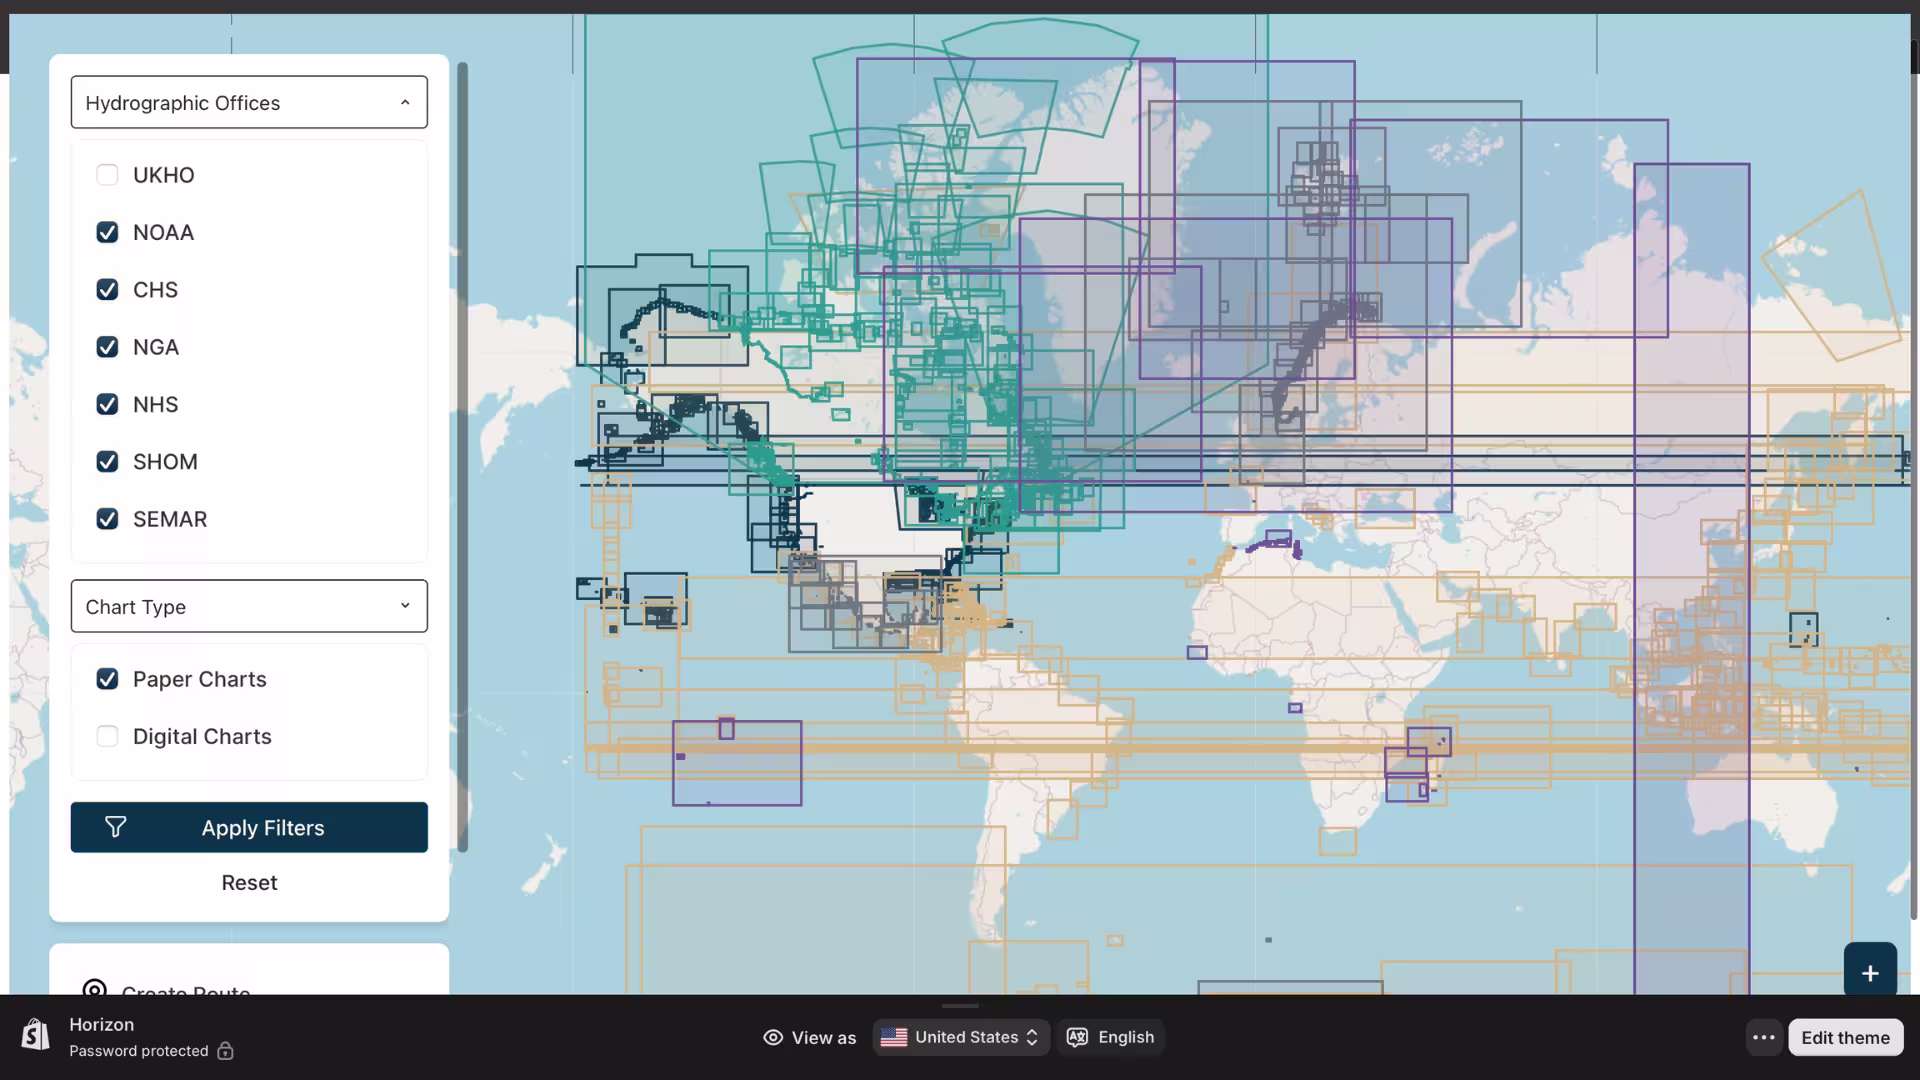
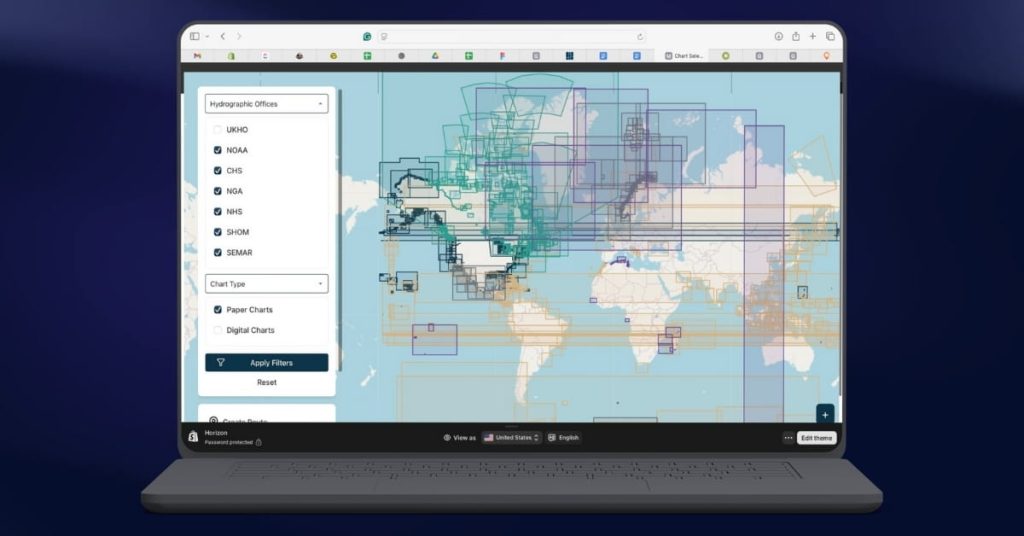
- A visual map interface accessible directly from the website for exploration.
- Dynamic filtering options allowing users to sort by chart type, geographic range, and hydrographic office.
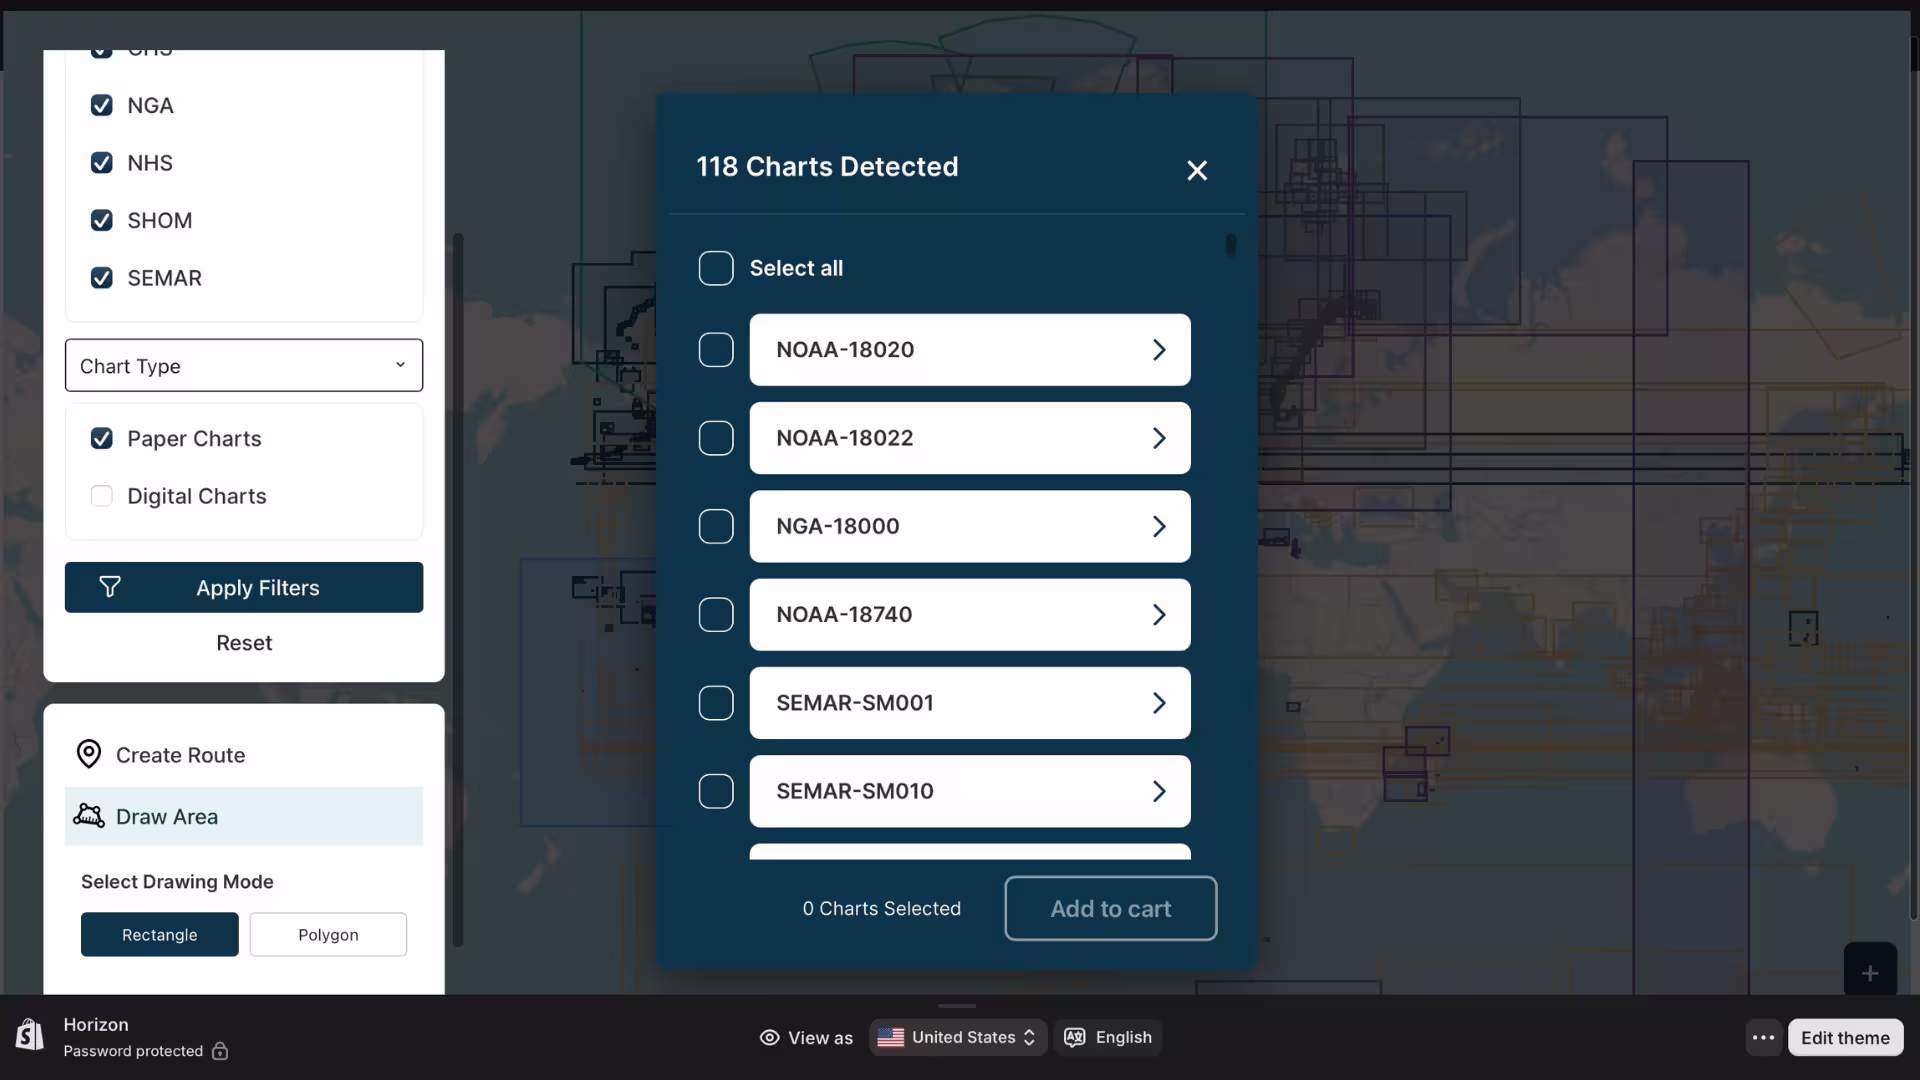
2. Advanced Filtering & Selection
- Implementation of a multi-parameter filtering system.
- Clear metadata display for each individual chart.
- A user-friendly, guided selection flow.
3. Purchase & Request Flow
- Direct “Add-to-cart” functionality for immediate purchases.
- An integrated option to request digital charts for non-standard or customized needs.
4. Post-MVP Enhancements (Extension Phase)
- Improved chart selector UX based on client feedback.
- Area-based selection enhancements and advanced filtering flexibility.
- Overall performance optimizations.
5. System Expansion
- Successfully integrated a new hydrographic office into the system.
- Ensured full compatibility with existing filtering and data structures, strengthening long-term client collaboration.
Technical Challenges Conquered
Building a GIS-powered eCommerce tool required overcoming several complex technical hurdles:
- Complex Geospatial Data Handling: Managing large volumes of GIS data with accurate rendering was challenging. This was solved by optimizing map rendering techniques, implementing lazy loading and data chunking, and creating efficient indexing of chart datasets.
- UX Complexity in Map-Based Selection: Balancing advanced GIS functionality with user simplicity was key. The team designed an intuitive filtering hierarchy, reduced cognitive load through guided interactions, and executed iterative UX improvements.
- Integration with Shopify eCommerce: Aligning GIS-based selection with Shopify’s standard cart system required custom mapping between chart data and Shopify products, alongside middleware logic to seamlessly sync map selections with the shopping cart.
- Data Standardization: Dealing with different data formats across various hydrographic offices was solved by normalizing the data schema, building flexible ingestion pipelines, and ensuring a consistent UX across datasets.
- Evolving Requirements: To manage post-delivery feature extensions, the team adopted a modular architecture for scalability and maintained agile delivery cycles driven by feedback loops.
Before vs. After: The Chart Discovery Experience
Business Impact & Results
The Shopify GIS Project successfully achieved its primary goals: improving navigation efficiency, reducing dependency on manual inquiries, and enhancing scalability.
Business Impact
- Improved chart discoverability.
- Increased user engagement with map-based navigation.
- Higher conversion potential through guided selection.
- Strengthened client trust and long-term partnership.
Product Impact
- Scalable GIS-commerce architecture established.
- Reusable components created for future expansion.
- Enhanced UX specifically tailored for technical product discovery.
Metrics Used to Measure Success
- Conversion Rate (Chart View → Purchase)
- Add-to-Cart Rate
- Time to Find Relevant Chart
- Drop-off Rate in Selection Funnel
- Number of Digital Chart Requests
- System Performance (Map Load Time)
Key Learnings & Future Opportunities
Key Learnings
- GIS-based products require a strong balance between technical depth and UX simplicity.
- Early investment in data standardization severely reduces long-term complexity.
- Modular systems enable far smoother post-launch scalability.
- Continuous client collaboration is the main driver for a better product-market fit.
Future Opportunities for the Platform
- AI-based chart recommendations.
- Saved searches & deeper user personalization.
- Advanced analytics dashboard for tracking user behavior.
- Mobile optimization for field users.
- Subscription-based access to chart libraries.
Conclusion
The Shopify GIS Project successfully transformed a complex chart discovery process into a streamlined, user-friendly experience. By combining geospatial intelligence with eCommerce capabilities, the platform now enables efficient chart selection, purchase, and scalability, positioning American Nautical Services for long-term growth in the maritime solutions space.